

In the ever-evolving landscape of Data Science, Anomaly Detection stands out as a pivotal technique, empowering businesses to safeguard their operations and optimize their processes. Hence, understanding the nuances of this powerful tool is essential for every Data Science professional, Mid-level Manager and Researcher. Our case study delves into the intricate world of anomaly detection, highlighting its transformative impact and our AI courses deal with the topic in great detail.
Imagine a scenario where a financial institution detects fraudulent transactions in real time, preventing potential losses and securing customer trust. Or consider a healthcare provider identifying unusual patterns in patient data, leading to early diagnosis and improved treatment outcomes. These industry-specific examples which are discussed in our Applied Data Science and Artificial Intelligence certification, underscore the critical role Anomaly Detection plays in enhancing operational efficiency and driving strategic decision-making.
What is an Anomaly?
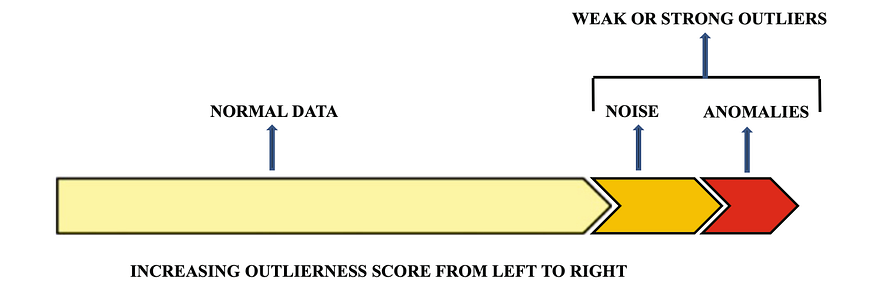
An outlier or anomaly is a data point where the actual value deviates significantly from the model’s prediction. These can arise from various sources, such as incorrect data recording, noise or the presence of data from a different distribution — imagine a few grapefruits mixed with oranges or a rare 7-foot-tall individual. While outliers may include irrelevant noise, anomalies are the intriguing outliers we focus on. Noise acts as the boundary between normal data and true anomalies, often appearing as weak outliers that don’t meet the criteria to be considered noteworthy. For instance, data points on the edges of clusters are often labeled as noise rather than anomalies. Understanding this distinction is crucial in anomaly detection, enabling us to filter out the irrelevant and zero in on data points that offer valuable insights.
“Outliers are not necessarily a bad thing. These are just observations that do not follow the same pattern as the other ones. But it can be the case that an outlier is very interesting. For example, if in a biological experiment, a rat is not dead whereas all others are, then it would be very interesting to understand why. This could lead to new scientific discoveries. So, it is important to detect outliers.”
— Pierre Lafaye de Micheaux, Author and Statistician
Outlier Detection Algorithms
Outlier detection algorithms build a model of normal data patterns and then evaluate how much a given data point deviates from these patterns, assigning it an outlier score. The choice of the model is critical; an incorrect model can lead to poor results. For example, a linear regression model may perform poorly if the data is arbitrarily clustered, incorrectly flagging data points as outliers due to a poor fit with the model’s assumptions. Therefore, selecting the right model requires understanding the relevant deviations for your specific application. Some common outlier detection algorithms include –
Isolation Forest
The Isolation Forest algorithm is a powerful tool for anomaly detection, designed to ‘isolate’ observations by randomly selecting features and split values within their range. This process creates a tree structure, where the number of splits needed to isolate a sample equates to the path length from the root to the terminating node. Averaging these path lengths across a forest of random trees provides a measure of normality — anomalies produce noticeably shorter paths due to random partitioning. When a collection of trees consistently shows shorter path lengths for specific samples, those samples are likely anomalies. Isolation Forest is particularly efficient for outlier detection in high-dimensional datasets, offering a robust method to identify unusual patterns.
Local Outlier Factor
Another effective approach for outlier detection in moderately high-dimensional datasets is the Local Outlier Factor (LOF) algorithm. LOF computes a score reflecting the degree of abnormality of each observation by measuring its local density deviation relative to its neighbors. The core idea is to identify samples with significantly lower density compared to their surrounding points. The local density is derived from the k-nearest neighbors, and the LOF score is the ratio of the average local density of these neighbors to the point’s local density. Normal instances have similar densities to their neighbors, whereas anomalies exhibit much lower densities.
The LOF algorithm’s strength lies in its ability to consider both local and global properties of the dataset, performing well even when anomalies have different underlying densities. It focuses on how isolated a sample is within its neighborhood, rather than in the entire dataset.
Angle-Based Outlier Detection (ABOD)
ABOD differs from traditional distance-based methods by assessing the variance in the angles between the difference vectors of a point to the other points. This approach is particularly effective in high-dimensional data, where distance-based methods often deteriorate due to the “curse of dimensionality”
The ABOD method has several advantages, including not relying on any parameter selection that could influence the quality of the achieved ranking.
k-Nearest Neighbors Detector
It measures the distance of an observation to its kth nearest neighbor, which serves as the outlier score. This approach is based on the idea that outliers will have larger distances to their neighbors compared to inliers. The following three methods can be used to calculate the outlier score: using the distance to the kth neighbor (largest), the average distance to all k neighbors (mean), or the median distance to k neighbors (median).
Local Correlation Integral (LOCI)
The Local Correlation Integral (LOCI) method excels at identifying outliers and groups of outliers, also known as micro-clusters. LOCI offers unique advantages compared to traditional methods. Firstly, it automatically determines a data-driven cut-off to classify points as outliers, eliminating the need for users to manually set cut-off values. Secondly, LOCI provides a LOCI plot for each point, offering a comprehensive summary of the data in the vicinity of the point, including clusters, micro-clusters, their sizes, and inter-cluster distances. This feature-rich approach stands out as it provides more detailed information compared to methods that output a single outlier score for each point.
In practice, LOCI works by computing the local correlation integral, which measures the density of points in the neighborhood of a given point. By analyzing the local structure of the data, LOCI can effectively identify outliers and micro-clusters based on the density and relationships between neighboring points. This method is particularly valuable for its ability to offer detailed insights into the data distribution and to automatically determine outlier cut-offs, making it a valuable tool for anomaly detection in various applications.
Feature Bagging
Feature Bagging is a meta-estimator designed for outlier detection that enhances predictive accuracy and controls overfitting by fitting multiple base detectors on different subsets of the dataset and combining their predictions through averaging or other methods. This method constructs multiple sub-samples by randomly selecting a subset of features, inducing diversity among the base estimators. The prediction score is then generated by aggregating the outputs of all base detectors, providing a robust measure of outlier likelihood for each observation.
Python Outlier Detection (PyOD)
PyOD is a versatile Python library tailored for detecting anomalies in multivariate data, making it ideal for projects of all sizes. Whether you’re working with small-scale datasets or tackling larger ones, PyOD offers a comprehensive suite of over 50 detection algorithms, from classical approaches like LOF to cutting-edge methods like ECOD and DIF.
Designed by Yue Zhao, Zain Nasrullah, and Zheng Li, PyOD addresses the need for a robust outlier detection tool. It stands out with its open-source nature, detailed documentation, and practical examples for a variety of algorithms. Key features include support for advanced models such as Neural Networks, Deep Learning, and Outlier Ensembles, optimized performance through JIT compilation and parallelization using numba and joblib, and a thorough performance evaluation via ADBench: Anomaly Detection Benchmark, which compares 30 algorithms across 57 datasets.
Artificial Intelligence Courses
At SunitechAI, we empower professionals to leverage tools like PyOD to elevate their data science and AI skills, driving innovation and excellence in their careers. Check out our Anomaly Detection case study to master these cutting-edge techniques and stay ahead in the dynamic tech landscape.
Elevate your data science expertise with SunitechAI’s Applied Data Science in Enterprises certification. Master Descriptive Statistics, Supervised and Unsupervised Learning, Anomaly Detection, Recommendation Systems, Time Series Forecasting, and Deep Learning. Apply these models to real-world use cases like demand prediction, fraud detection, and image recognition on a cloud platform, and deploy them to an endpoint. Empower yourself to lead and innovate in the dynamic field of data science. Join us and transform your career today!